Electrify Chicago
An independent tool for viewing City of Chicago building data
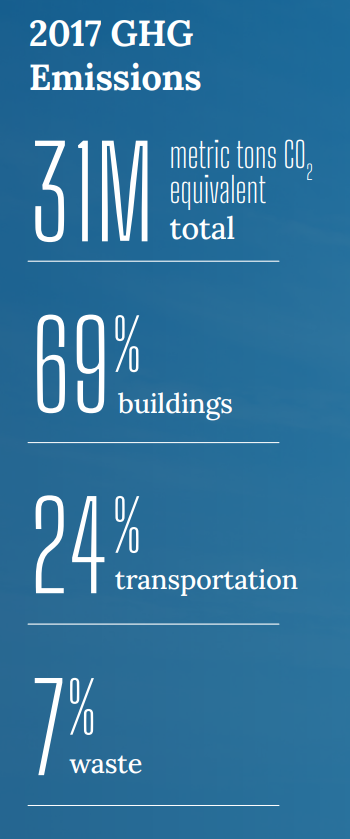
According to the
2022 Chicago Climate Action Plan ,
69% of Chicago's emissions come from buildings, making
building emissions our biggest challenge and our biggest opportunity as a city
to tackle climate change. At Electrify Chicago, we showcase building performance using
publicly available data supplemented by community-submitted photographs and building
owners.
,
69% of Chicago's emissions come from buildings, making
building emissions our biggest challenge and our biggest opportunity as a city
to tackle climate change. At Electrify Chicago, we showcase building performance using
publicly available data supplemented by community-submitted photographs and building
owners.
Start by looking at Chicago's buildings with the highest greenhouse gas intensity i.e. emissions per square foot. Large, efficient, buildings can perform much better than very inefficient small buildings on this metric.
New Article
📰 $30 Million In Missed Fines
The City Of Chicago failed to collect $30 million in potential fines from the building benchmarking ordinance, reducing transparency and accountability.
Legislative update! 🎉
As of late January 2024, legislation is being introduced to require new use more efficient forms of water and space heating, via the Clean And Affordable Buildings Ordinance (CABO), which will reduce the number of highly polluting and inefficient buildings that end up on this site.
If you're in Chicago,
write to your alderman to support the CABO!
Chicago Buildings by Greenhouse Gas Intensity
Note: Data includes large Chicago buildings with data from 2022, unless explicitly stated otherwise.
Note: This data only includes buildings whose emissions are reported
under the
Chicago Energy Benchmarking Ordinance. According to the City “As of 2016,
this list includes all commercial, institutional, and residential buildings larger than
50,000 square feet.” This dataset is also then filtered to only buildings with
reported emissions > 1,000 metric tons CO2 equivalent.
The latest year of data is from 2022, but we update the site regularly when new data is available, and some buildings may have failed to report that year, and only have older data available.
| Property Name / address | Primary Property Type |
Greenhouse Gas Intensity (kg CO2 eq./sqft) |
Total Greenhouse Emissions (metric tons CO2 eq.) |
|---|---|---|---|
|
Rush University Medical Center
🚨
1653 W Congress Pkwy
| Hospital (General Medical & Surgical) | 23.7 kg/sqft #36 Highest
| 92,454 tons #2 Highest
|
|
Holy Cross Hospial
🚩
2701 W 68th St
| Hospital (General Medical & Surgical) | 23.7 kg/sqft #36 Highest
| 9,723 tons
Highest 2%
|
|
MB Ice Arena
🚩
1801 W Jackson Blvd
| Ice/Curling Rink | 23.5 kg/sqft #39 Highest
| 2,991 tons
Highest 14%
|
|
Jones Laboratory
🚩
(UChicago)
5747 S Ellis Ave
| Laboratory | 23.5 kg/sqft #39 Highest
| 1,699 tons
Highest 27%
|
|
26 N Halsted St
🚩
26 N Halsted St
| Office | 23.3 kg/sqft #40 Highest
| 1,335 tons
Highest 36%
|
|
Physics Research Center
🚩
933 E 56th Street
| Laboratory | 23.0 kg/sqft #42 Highest
| 1,542 tons
Highest 30%
|
|
Jewel Osco, 02502-Clybourn & Wrightwood
🚩
2550 N Clybourn St
| Supermarket/Grocery Store | 23.0 kg/sqft #42 Highest
| 1,958 tons
Highest 24%
|
|
University Club of Chicago
🚩
76 E Monroe St
| Hotel | 22.8 kg/sqft #44 Highest
| 3,278 tons
Highest 12%
|
|
832 854 W FULTON MARKET
🚩
832 854 W FULTON MARKET
| Mixed Use Property | 22.8 kg/sqft #44 Highest
| 2,201 tons
Highest 21%
|
|
53100516--CHICAGO
🕰️
2112 N ASHLAND AVE
| Supermarket/Grocery Store | 22.8 kg/sqft | 1,825 tons |
|
Provident Hospital
🚩
500 E 51st St
| Hospital (General Medical & Surgical) | 22.6 kg/sqft #45 Highest
| 8,449 tons
Highest 3%
|
|
Belmont and Central; A&G Fresh Market
🕰️
5630 W Belmont Ave
| Supermarket/Grocery Store | 22.6 kg/sqft | 1,220 tons |
|
Center on Halsted
🚩
3656 N Halsted St
| Mixed Use Property | 22.5 kg/sqft #46 Highest
| 2,335 tons
Highest 19%
|
|
Page Building
🚩
177 N State St
| Office | 22.3 kg/sqft #47 Highest
| 1,183 tons
Highest 39%
|
|
Fosco Park
🕰️
1312 S Racine Ave
| Other - Recreation | 22.2 kg/sqft | 1,344 tons |
Data Source:
Chicago Energy Benchmarking Data